

TRREB’s Market Watch Report
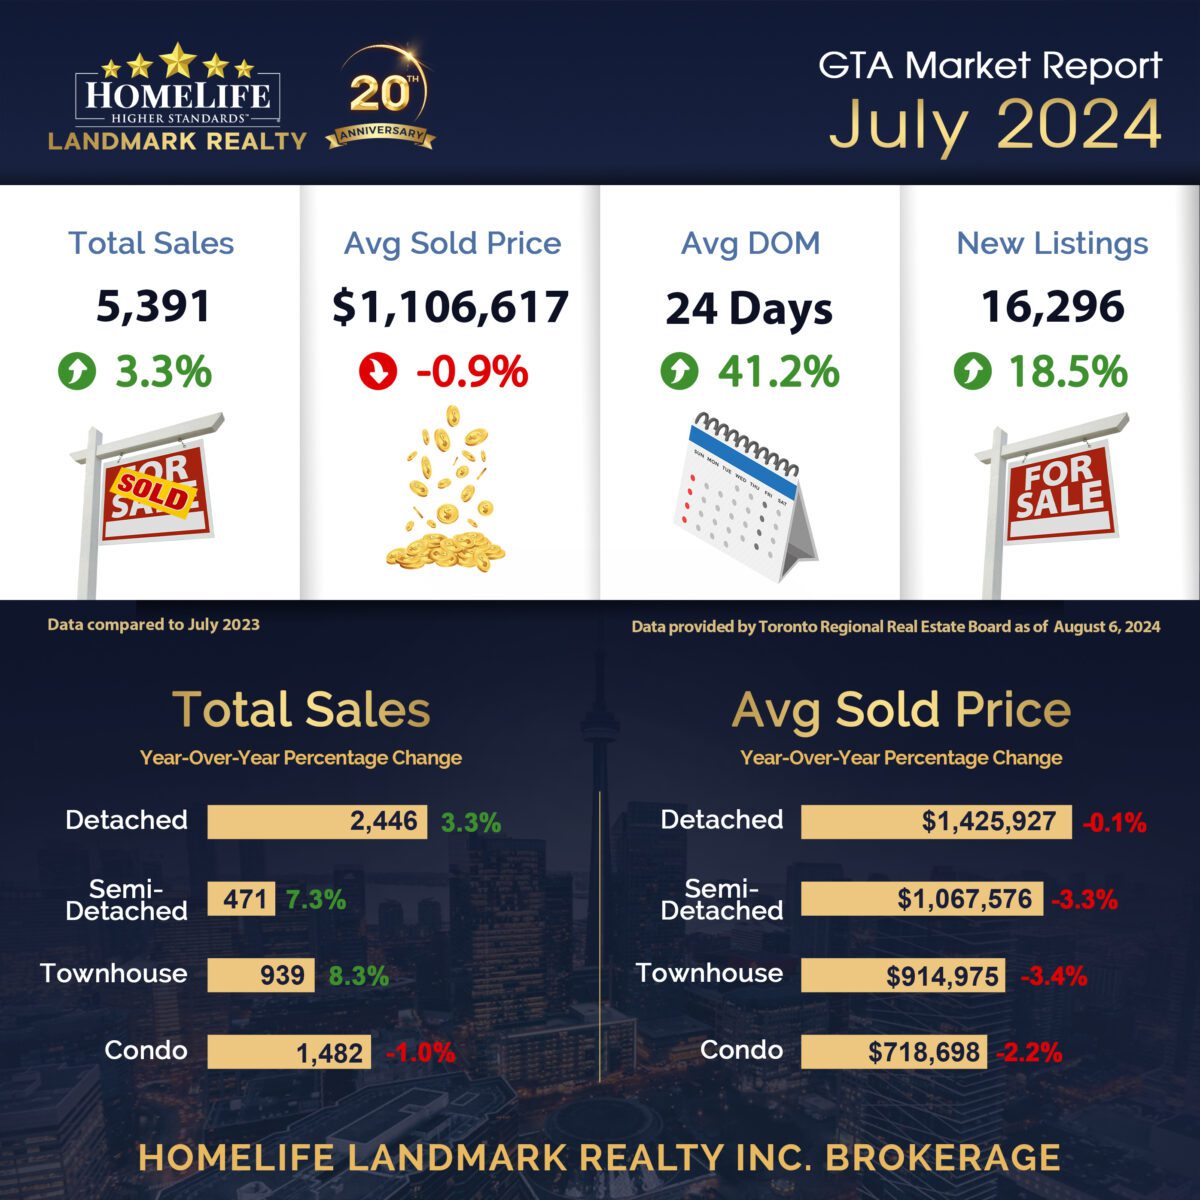
Greater Toronto Area (GTA) home sales in July 2024 were up compared to July 2023. While sales were up from last year, buyers continued to benefit from more choice in the GTA marketplace, with annual growth in new listings outstripping that of sales.
GTA REALTORS® reported 5,391 home sales through TRREB’s MLS® System in July 2024 – a 3.3% increase compared to 5,220 sales reported in July 2023. New listings entered into the MLS® System amounted to 16,296 – up by 18.5% year-over-year. On a seasonally adjusted basis, July sales and new listings edged lower compared to June.
The MLS® Home Price Index Composite benchmark was down by approximately five per cent on a year-over-year basis in July 2024. The average selling price of $1,106,617 was down by 0.9% over the July 2023 result of $1,116,950. On a seasonally adjusted monthly basis, both the MLS® HPI Composite and the average selling price were up slightly compared to June 2024.
🔍 Market Stats Quick Overview (Data compared to July 2023):
📎 Total Sales: 5,391 ⬆3.3%
📎 Avg Sold Price: $1,106,617 ⬇0.9%
📎 Avg DOM: 24 days ⬆41.2%
📎 New Listing: 16,296 ⬆18.5%
Source: https://trreb.ca/market-data/market-watch/
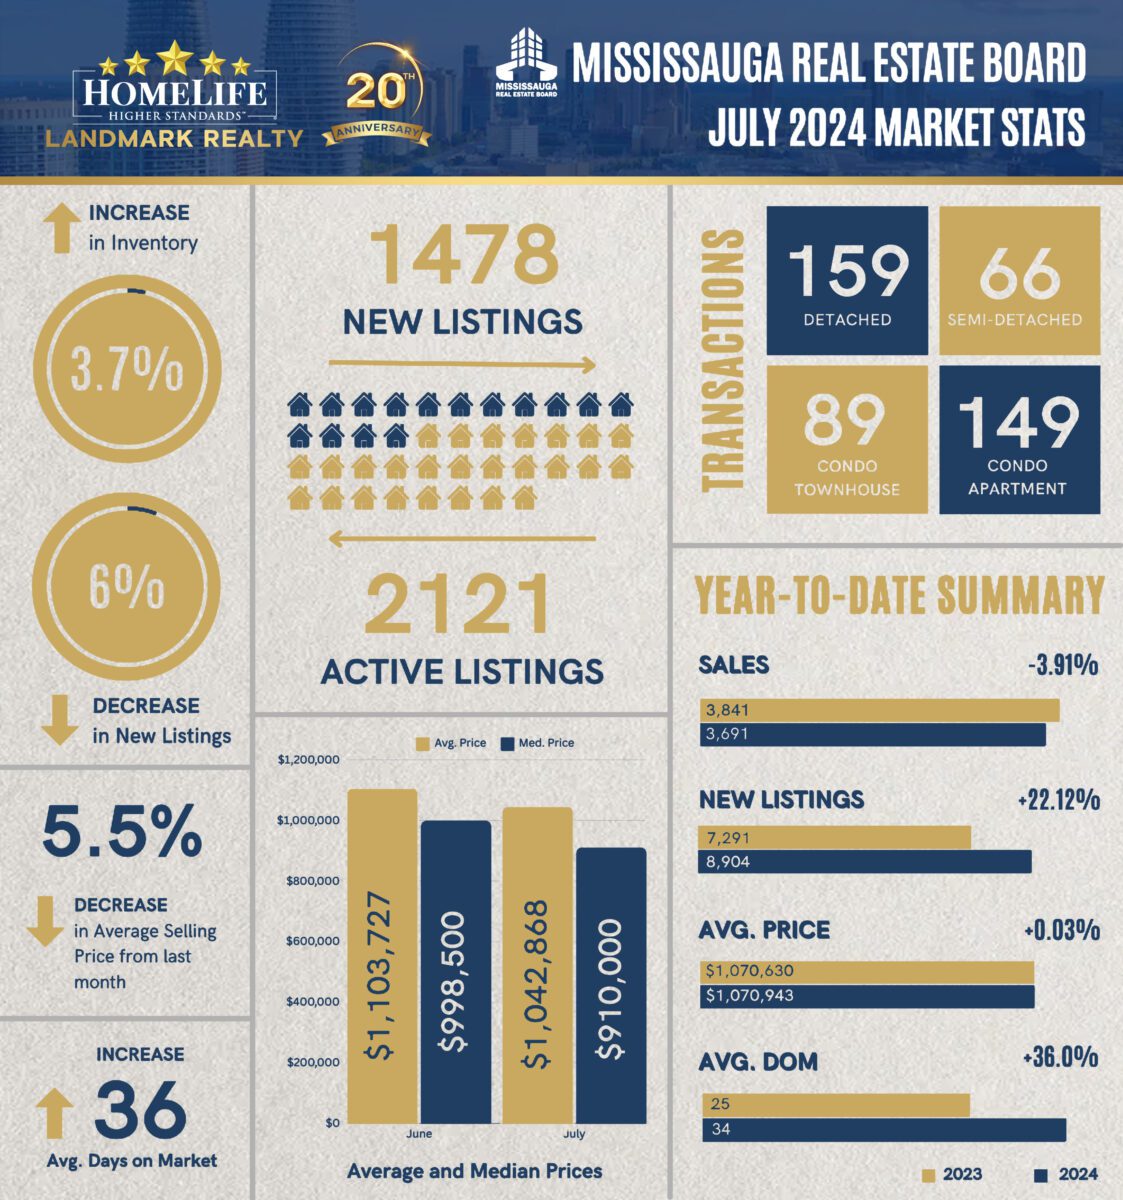
MREB’s Market Watch Report
The number of homes sold in Mississauga via the MLS® System of the Cornerstone Association of REALTORS® (Cornerstone) totaled 479 units in July 2024. This was a small gain of 3% (14 sales) from July 2023.
The MLS® Home Price Index (HPI) tracks price trends far more accurately than is possible using average or median price measures. The overall MLS® HPI composite benchmark price was $1,082,400 in July 2024, a decline of 5.3% compared to July 2023.
🔍 Market Stats Quick Overview (Year to Date):
📎 Total Sales: 3,691 ⬇3.91%
📎 Avg Sold Price: $1,070,943 ⬆0.03%
📎 Avg DOM: 34 days ⬆36%
📎 New Listing: 8,904 ⬆22.12%
Source: https://mreb.ca/2024
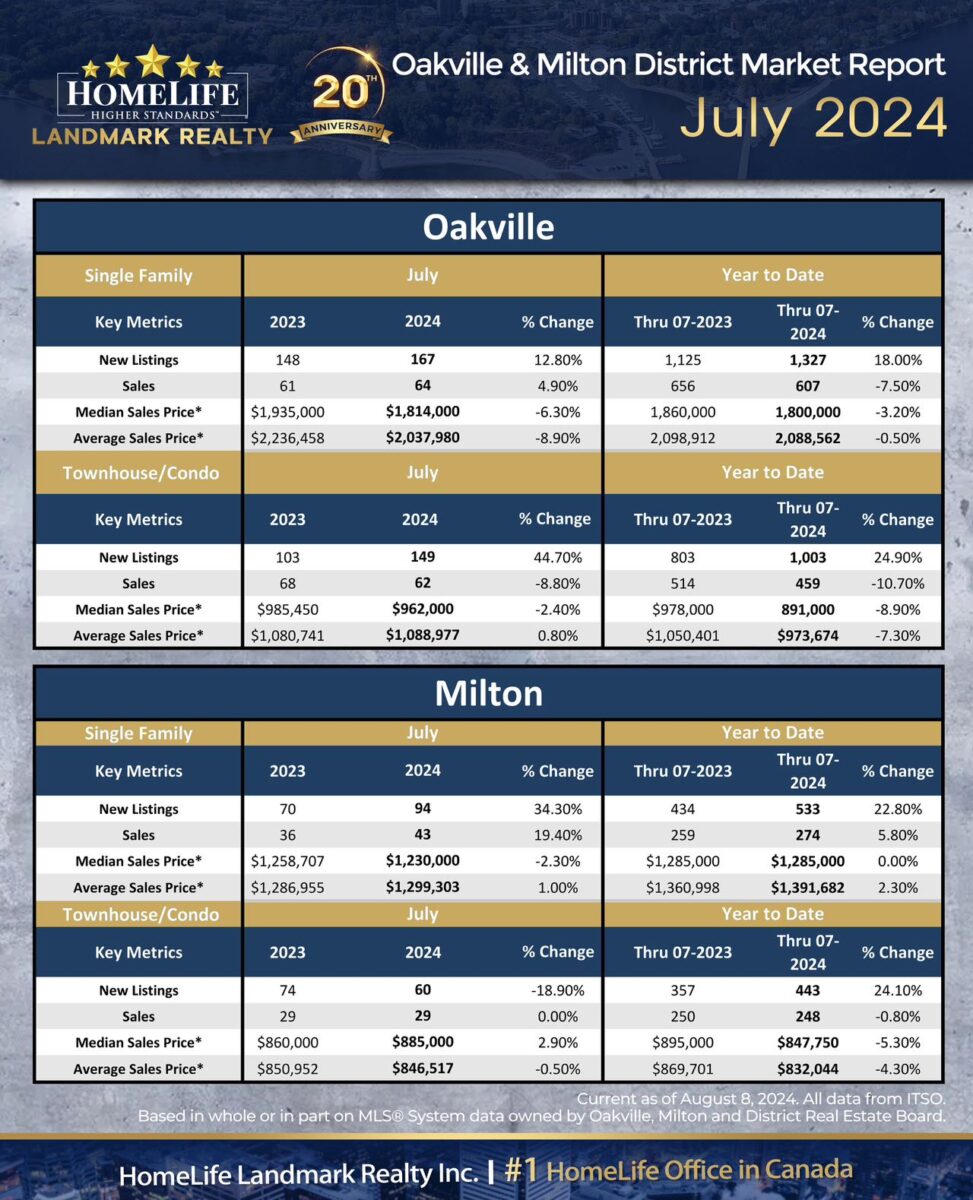
OMDREB’s Market Watch Report
According to figures released August 6 by The Oakville, Milton and District Real Estate Board (OMDREB), the number of all property sales reported by OMDREB REALTORS® decreased 6.9% for Single Family homes and 6.4% for Townhouse/ Condo homes compared to July 2023.
Median Sales Price decreased 2.9% to $1,358,750 for Single Family homes and 6.6% to $803,514 for Townhouse/Condo homes. The total number of new property listings increased 13.3% for Single Family homes and 26.7% for Townhouse/Condo homes compared to this time last year.
For homes processed through the OMDREB MLS® system, the number of Days on Market increased 41.2% for Single Family homes and 42.9% for Townhouse/Condo homes this July. Year over year, Inventory increased 56.0% for Single Family homes and 89.5% for Townhouse/Condo homes.
Source: https://omdreb.ca/local-market-stats/
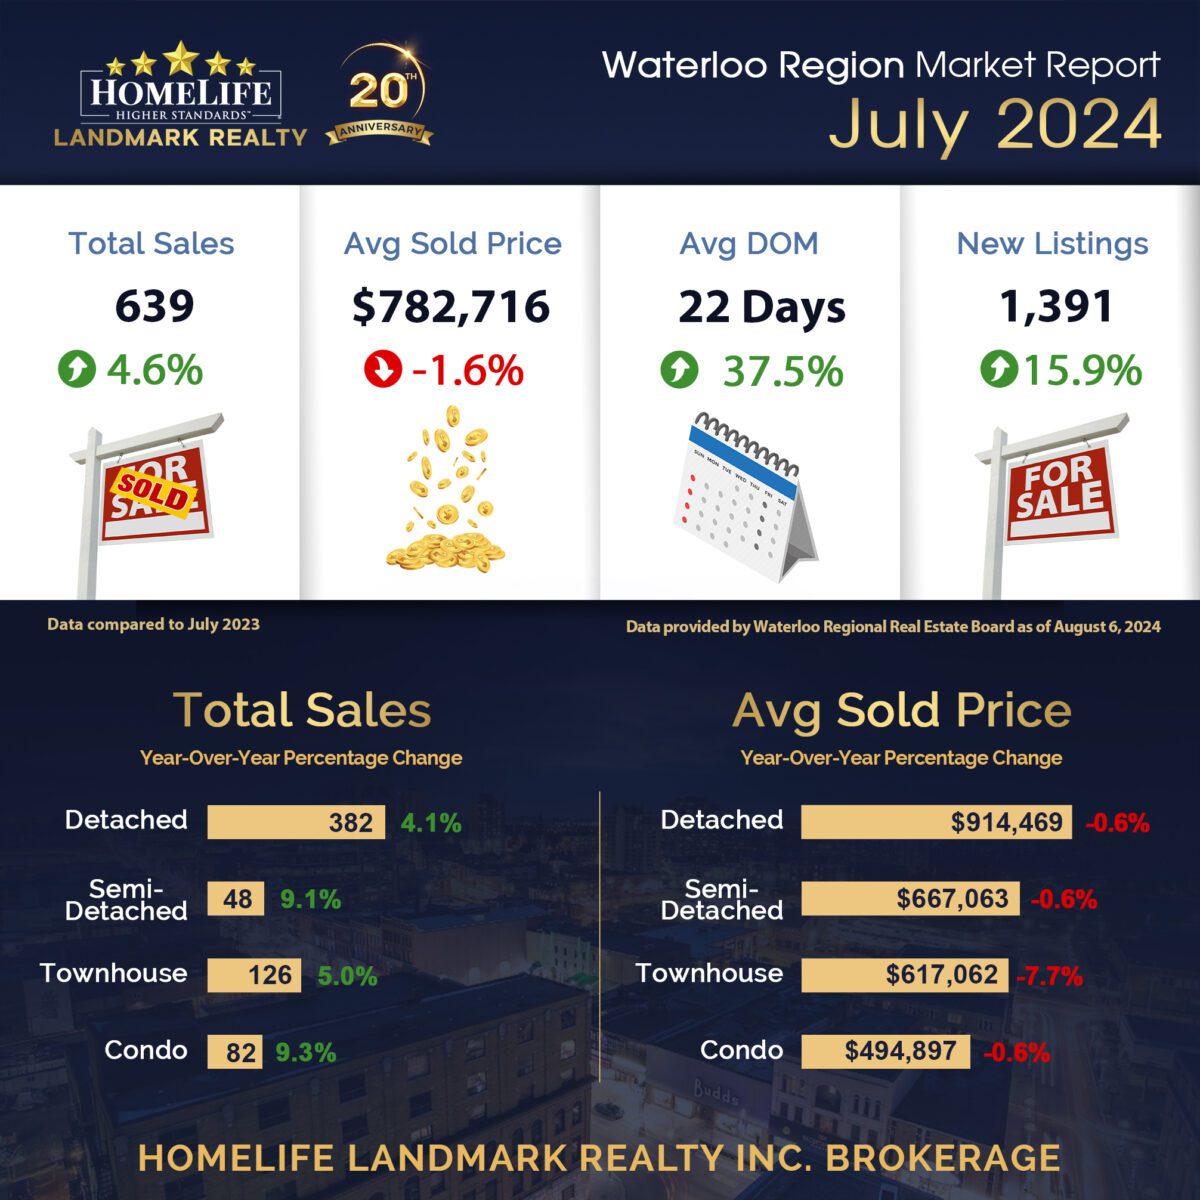
WRAR’s Market Watch Report
In July, a total of 639 homes were sold in the Waterloo Region via the Multiple Listing Service® (MLS®) System of the Cornerstone Association of REALTORS® (Cornerstone). This represents an increase of 4.6% compared to the same period last year and a decline of 16.6% compared to the average number of homes sold in the previous ten years for the same month.
Total residential sales in July included 382 detached homes (up 4.1% from July 2023), and 126 townhouses (up 5.0%). Sales also included 82 condominium units (up 9.3%) and 48 semi-detached homes (up 9.1%). The average sale price for all residential properties in Waterloo Region was $782,716. This represents a 1.6% decrease compared to July 2023 and a 0.9% decrease compared to June 2024.
🔍 Market Stats Quick Overview (Data compared to July 2023):
📎 Total Sales: 639 ⬆4.6%
📎 Avg Sold Price: $782,716 ⬇1.6%
📎 Avg DOM: 22 days ⬆37.5%
📎 New Listings: 1,391 ⬆15.9%